Human Resources Employee Distribution
- Dec 8, 2024
- 6 min read
Updated: Dec 9, 2024

LINK TO GITHUB:
TOOL USED:
Data Cleaning & Analysis - MySQL Workbench
Data Visualization - PowerBI
SOURCE ATTRIBUTION
SQL & PowerBI Project for Data Analysts- Her Data project
INTRODUCTION
The dataset used for this analysis is an HR Data with over 22000 rows and 14 columns from the year 2000 to 2020. This dataset has been sourced from Her data projects on SQL. The primary goal of analyzing this dataset is to ascertain the Time to Termination (Turnover) of employees, to know the gender breakdown of employees in the company, the department with the highest turnover rate, how has the company's employee count changed over time based on hire and term dates (i.e termination dates)? etc. This analysis will help provide valuable insights into Employee Demographics Insights like (Gender Distribution, Age Group Distribution, Race Diversity) and Location-wise Distribution which is Analyzing employee distribution by city or state.
BACKGROUND & MOTIVATION
The dataset provided contains comprehensive employee information, including demographic details, job titles, locations, and employment history. This type of data is crucial for organizations looking to understand workforce composition, identify trends in employee retention, and optimize human resource practices. The motivation behind analyzing such a dataset is to derive actionable insights that can help in talent management, recruitment strategies, diversity and inclusion efforts, and overall organizational growth.
Specifically, the background of this dataset highlights factors such as:
Employee demographics (age, gender, race) which play a significant role in analyzing workforce diversity.
Employee tenure and job history (hire date, term date) which are useful for tracking retention rates and determining factors contributing to employee turnover.
Department and job roles which help identify organizational structure and assess performance and satisfaction within specific job functions.
The goal of analyzing this dataset is to uncover patterns that will aid in making data-driven decisions that improve employee satisfaction, retention, and diversity across the company.

DATA COLLECTION
The dataset used for this analysis is collected from the internal records of an organization. It is likely gathered and maintained by the Human Resources (HR) or People Operations department. The collection process involve various sources and methodologies, such as:
1. HR Management Systems (HRMS): The primary source of data is typically an HRMS, where employee records are stored and continuously updated. This system might capture employee information such as personal details (name, gender, race, age), job title, department, hire date, and term date (if applicable).
2. Employee Onboarding Process: During the onboarding process, employees provide essential information such as birthdate, gender, race, department, and job title. This data is recorded in the HRMS or relevant HR software used by the company.
3. Payroll Systems: Details about employee location (city, state) and department/job title could be obtained from payroll systems, which track employee work locations and their roles within the organization.
4. Surveys and Self-Reported Data: In some cases, employees may be asked to self-report demographic information such as race or gender during onboarding or annual employee surveys. This data would be recorded manually and added to the dataset.
5. Employee Termination Data: Information about employees who have left the organization (including the term date column) might be collected through exit interviews or the final settlement process. It helps track the duration of employment and reasons for leaving.
6. Automated Data Import and Integration: In larger organizations, data collection might also involve integration from multiple sources, such as LinkedIn profiles, performance management tools, and other internal platforms that track employee activities and changes in their job status.
The dataset is maintained in a centralized database and continuously updated as employees join, move between departments, or leave the organization. Data quality checks are essential in this process to ensure accuracy and completeness, especially for critical fields like hire date, term date, and age.
Ethical Considerations in Data Collection:
Privacy: Sensitive employee data such as birthdate, gender, and race must be handled with care and in compliance with data protection regulations (e.g., GDPR, HIPAA) to maintain confidentiality.
Accuracy: Ensuring the accuracy of demographic and job-related data is essential for analysis and decision-making. Discrepancies or outdated information could lead to incorrect conclusions.
DATASET LIMITATION
· The dataset does not contain performance-related data, which could be helpful for assessing employee satisfaction or productivity. Without performance information, it’s hard to correlate tenure or job title to employee performance.
· While departments and job titles are provided, salary data is absent, which would have helped in analyzing compensation trends or disparities across different groups or job levels.
Missing Data: Some columns such as race or termdate may have missing or incomplete information, which could impact the accuracy of analysis related to diversity or employee turnover.
ANALYSIS
Data Preparation
· Download the dataset from the resources section.
· Load the Human Resources.csv dataset into Excel.
· Import to Mysql for Data Cleaning
· Changed Hire date, and sort columns
· Renamed Id Column
· Used MODIFY,UPDATE, SELECT, ORDER BY, GROUP BY,CREATE DATABASE,ALTER etc in MySQL Workbench

QUESTIONS
1. What is the gender breakdown of employees in the company?
SELECT gender, COUNT(*) AS count FROM human_resources WHERE age >= 18 AND termdate = '2000-01-01'
GROUP BY gender;

2. What is the race/ethnicity breakdown of employees in the company?
SELECT race, COUNT(*) AS count FROM human_resources WHERE age >= 18
GROUP BY race ORDER BY count DESC;

3.What is the age distribution of employees in the company?
SELECT MIN(age) AS youngest, MAX(age) AS oldest FROM human_resources
WHERE age >= 18 and termdate = '2000-01-01';

SELECT FLOOR(age/10)*10 AS age_group, COUNT(*) AS count FROM human_resources
WHERE age >= 18
GROUP BY FLOOR(age/10)*10;
SELECT CASE
WHEN age >= 18 AND age <= 24 THEN '18-24' WHEN age >= 25 AND age <= 34 THEN '25-34' WHEN age >= 35 AND age <= 44 THEN '35-44' WHEN age >= 45 AND age <= 54 THEN '45-54' WHEN age >= 55 AND age <= 64 THEN '55-64' ELSE '65+'
END AS age_group, COUNT(*) AS count FROM
human_resources WHERE
age >= 18 and termdate = '2000-01-01' GROUP BY age_group
ORDER BY age_group;
SELECT
CASE
WHEN age >= 18 AND age <= 24 THEN '18-24' WHEN age >= 25 AND age <= 34 THEN '25-34' WHEN age >= 35 AND age <= 44 THEN '35-44' WHEN age >= 45 AND age <= 54 THEN '45-54' WHEN age >= 55 AND age <= 64 THEN '55-64' ELSE '65+'
END AS age_group, gender, COUNT(*) AS count
FROM
human_resources WHERE
age >= 18 and termdate = '2000-01-01' GROUP BY age_group, gender
ORDER BY age_group, gender;

4. How many employees work at headquarters versus remote locations?
SELECT location, COUNT(*) as count FROM human_resources
WHERE age >= 18 and termdate = '2000-01-01'
GROUP BY location;

5. What is the average length of employment for employees who have been terminated?
SELECT ROUND(AVG(DATEDIFF(termdate, hire_date)),0)/365 AS avg_length_of_employment FROM human_resources
WHERE termdate <= CURDATE() AND age >= 18;

6. How does the gender distribution vary across departments?
SELECT department, gender, COUNT(*) as count FROM human_resources
WHERE age >= 18 and termdate = '2000-01-01' GROUP BY department, gender
ORDER BY department;

7. What is the distribution of job titles across the company?
SELECT jobtitle, COUNT(*) as count FROM human_resources
WHERE age >= 18 and termdate = '2000-01-01' GROUP BY jobtitle
ORDER BY jobtitle DESC;

8. Which department has the highest turnover rate?
Turnover rate" typically refers to the rate at which employees leave a company or department and need to be replaced. It can be calculated as the number of employees who leave over a given time period divided by the average number of employees in the company or department over that same time period.
SELECT department, COUNT(*) as total_count,
SUM(CASE WHEN termdate <= CURDATE() AND termdate <> '2000-01-01' THEN 1 ELSE 0 END) as
terminated_count,
SUM(CASE WHEN termdate = '2000-01-01' THEN 1 ELSE 0 END) as active_count,
(SUM(CASE WHEN termdate <= CURDATE() THEN 1 ELSE 0 END) / COUNT(*)) as termination_rate FROM human_resources
WHERE age >= 18
GROUP BY department
ORDER BY termination_rate DESC;

9. What is the distribution of employees across locations by state?
SELECT location_state, COUNT(*) as count FROM human_resources
WHERE age >= 18 and termdate= '2000-01-01' GROUP BY location_state
ORDER BY count DESC;

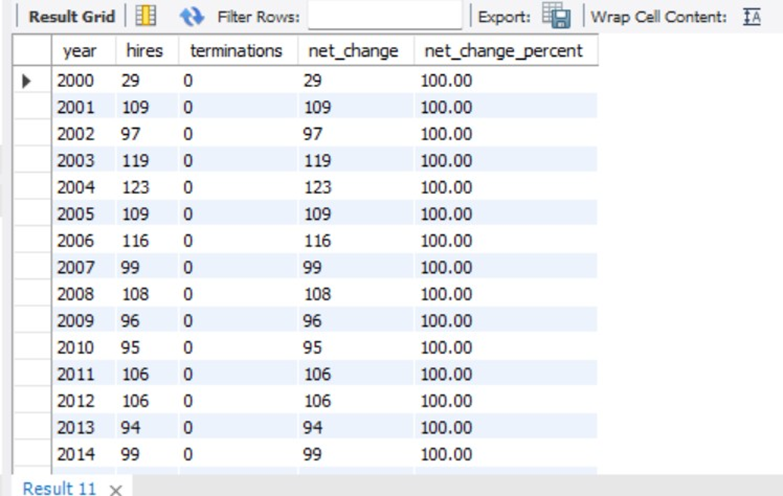
10. How has the company's employee count changed over time based on hire and term dates?
This query groups the employees by the year of their hire date and calculates the total number of hires, terminations, and net change (the difference between hires and terminations) for each year. The results are sorted by year in ascending order.
SELECT
YEAR(hire_date) AS year, COUNT(*) AS hires,
SUM(CASE WHEN termdate <> '2000-01-01' AND termdate <= CURDATE() THEN 1 ELSE 0 END) AS terminations,
COUNT(*) - SUM(CASE WHEN termdate <> '2000-01-01' AND termdate <= CURDATE() THEN 1 ELSE 0 END) AS
net_change,
ROUND(((COUNT(*) - SUM(CASE WHEN termdate <> '2000-01-01' AND termdate <= CURDATE() THEN 1 ELSE 0
END)) / COUNT(*) * 100),2) AS net_change_percent FROM
human_resources WHERE age >= 18 GROUP BY
YEAR(hire_date) ORDER BY
YEAR(hire_date) ASC;
11. What is the tenure distribution for each department? How long do employees work in each department before they leave or are made to leave?
SELECT department, ROUND(AVG(DATEDIFF(termdate, hire_date)),0)/365 as avg_tenure FROM human_resources
WHERE termdate <= CURDATE() AND age >= 18
GROUP BY department;

Dashboard Creation with Power bi
· Use Table from MySQL to generate the insight related to the dataset
· Named it “HR EMPLOYEE DISTRIBUTION REPORT” with Text box
· Use the variable Exit_Page as the key filter within the title bar.
· Assign KPI card for the variables “Average Length of Employment”to summarize the data values.
· Used Clustered Column chart, Bar Chart, Line Chart, Donut Chart etc for visualization.


RESULTS
There are more male employees
White race is the most dominant while Native Hawaiian and American Indian are the least dominant.
The youngest employee is 22 years old and the oldest is 59 years old.
5 age groups were created (18-24, 25-34, 35-44, 45-54, and 55-64). A large number of employees were 25-34 followed by 35-44 while the smallest group was 55-64.
A large number of employees work at the headquarters versus remotely.
The average length of employment for terminated employees is around 7 years.
The gender distribution across departments is fairly balanced but there are generally more male than female employees.
The Marketing department has the highest turnover rate followed by Training. The least turnover rate are in the Research and development, Support and Legal departments.
A large number of employees come from the state of Ohio.
The net change in employees has increased over the years.
The average tenure for each department is about 8 years with Legal and Auditing having the highest and Services, Sales and Marketing having the lowest.
CONCLUSION
This dataset offers rich insights into employee demographics, job titles, tenure, and departmental structures, enabling organizations to better understand their workforce composition. By analyzing this data, companies can identify patterns related to retention, turnover, diversity, and overall workforce distribution. These insights can be leveraged to enhance HR practices, improve employee engagement, and develop targeted strategies for recruitment and retention.
However, the analysis is limited by several factors, including missing data, the absence of performance metrics, and geographical biases. To overcome these limitations and gain more comprehensive insights, organizations could consider augmenting this dataset with additional information such as salary details, performance reviews, or employee satisfaction surveys.
Overall, while the dataset offers useful information, a more holistic approach that integrates additional variables and data sources would provide deeper insights and a clearer picture of the factors driving employee retention and satisfaction within the organization.
REFERENCES
1. Devon Edwards Joseph Lloyds Banking Group- Data Science Engineer at Lloyds Banking Group.
2. Louis Maiden (Data camp)


Comments